
L2BEAT is the industry-standard analytics and research platform for Ethereum Layer 2 networks. It tracks 100+ protocols — their risks, value secured, and activity — and its independent risk framework is the reference point for researchers, investors, and protocol teams across the ecosystem.
I'm the product designer — working closely with researchers, engineers, and product. My work spans information architecture, complex data tables and visualization, prototyping, and the design system that keeps a fast-evolving product consistent.
L2BEAT's research is deeply technical. Risk frameworks, proof systems, data availability. The interface has to carry that nuance without drowning the reader.
Protocol researchers need full depth; newcomers need orientation. Every screen balances information density against legibility.
The L2 ecosystem changes weekly. Designs must absorb new networks, new risk categories, and new data types without redesign.
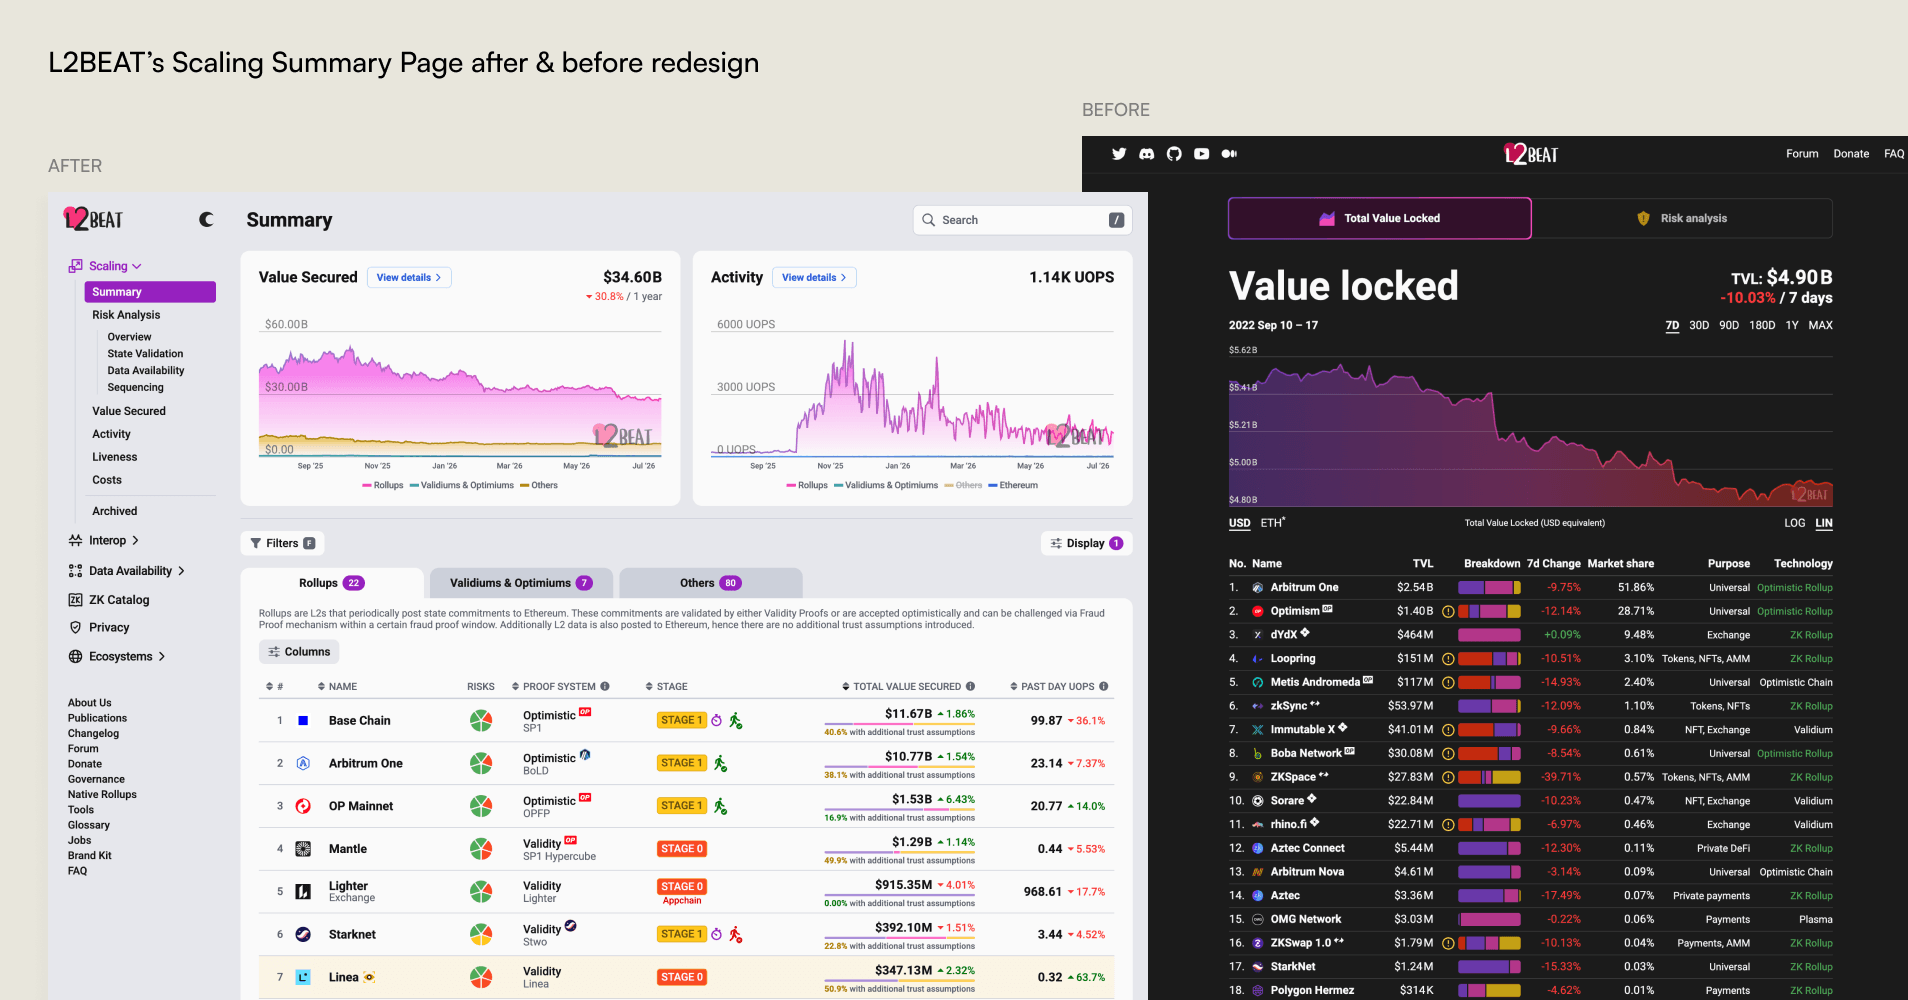
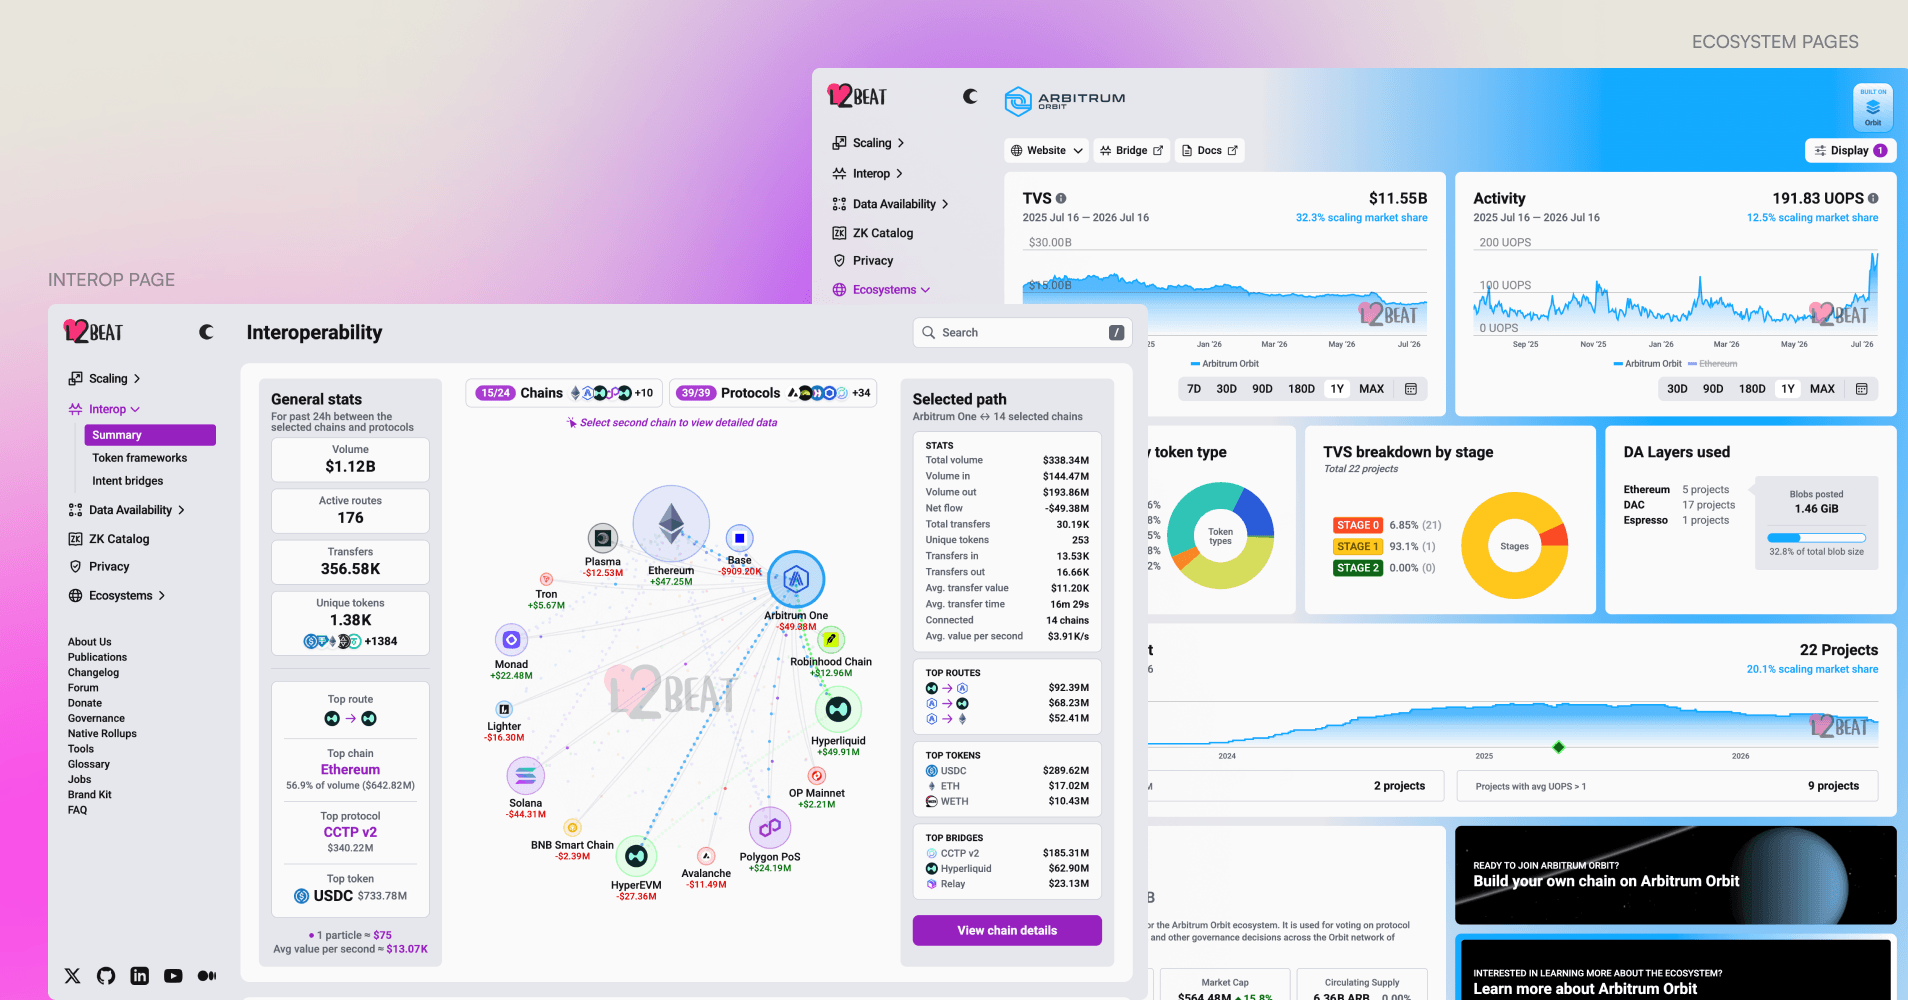
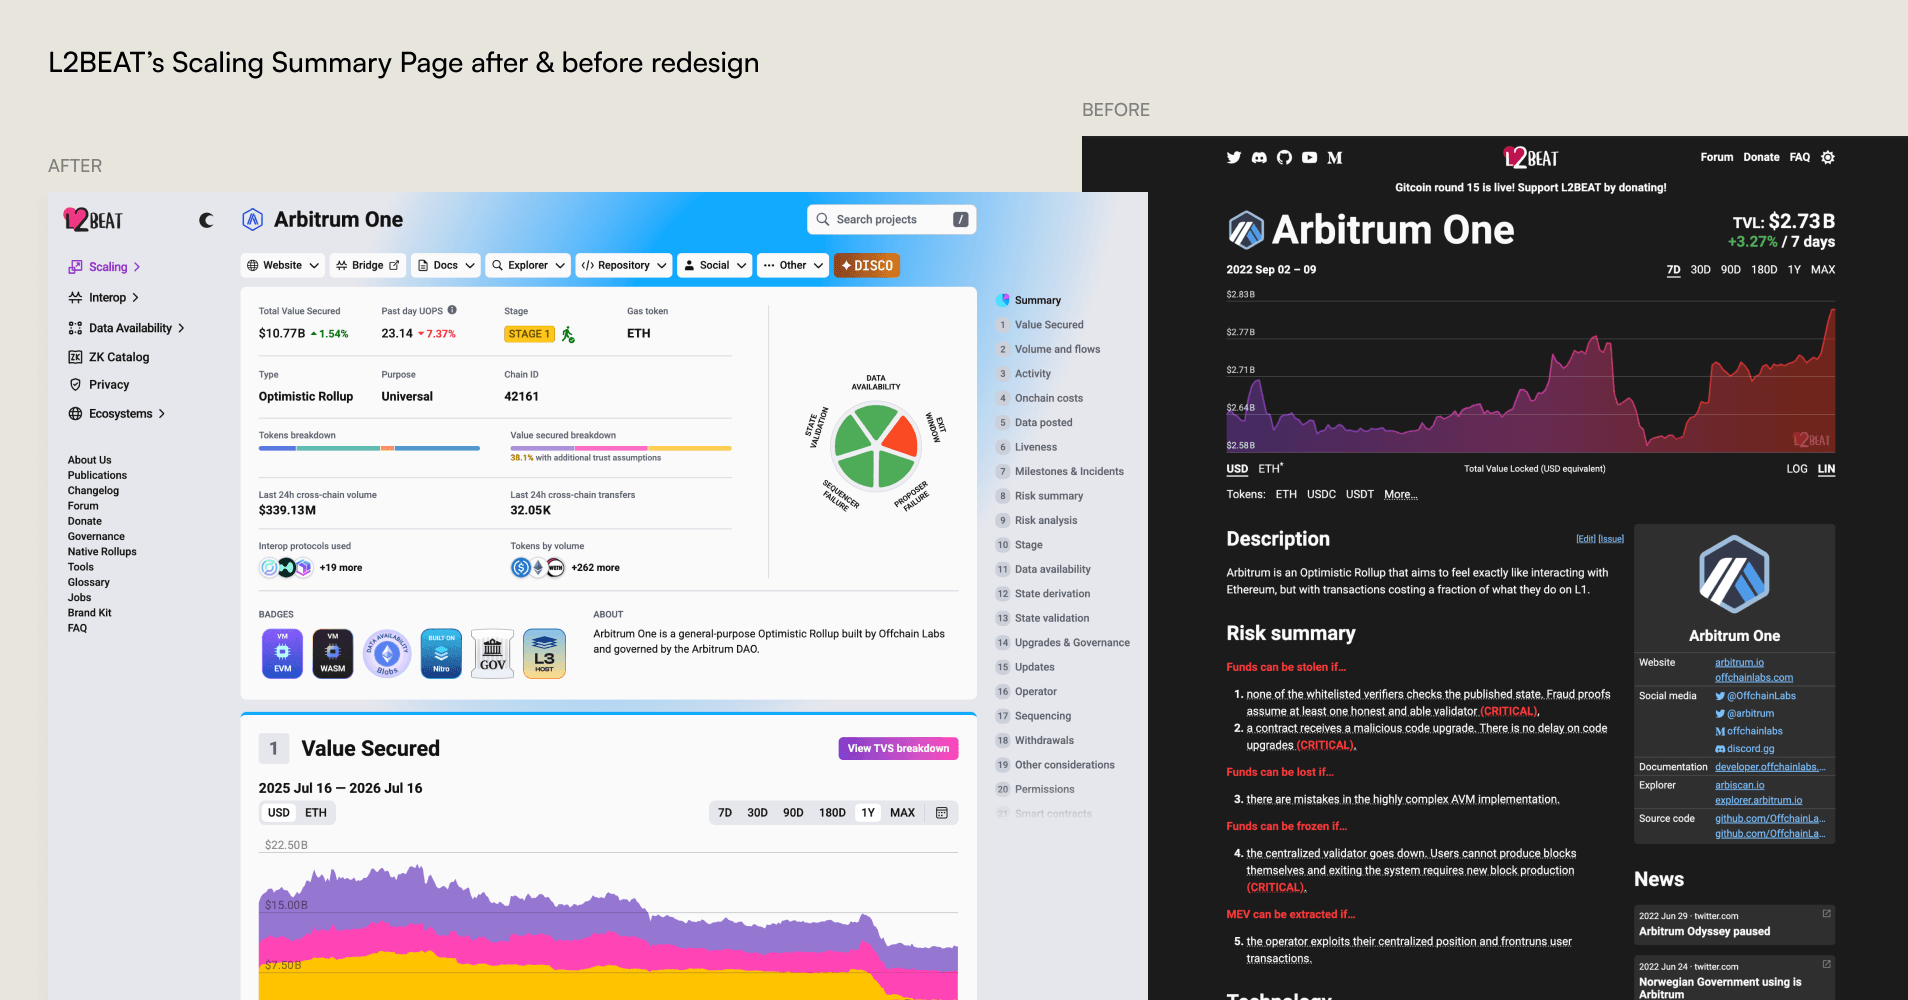
When I joined, l2beat.com was one chart and a table on a dark page. Working with the research and engineering teams — they defined the data and what mattered, I defined how the ecosystem sees it — I redesigned the platform end-to-end: navigation, the Scaling, Interop, Data Availability, ZK Catalog and Ecosystems sections, search, filtering, and the summary dashboard. A simple ranking site became the ecosystem's analytics workbench. Not in one launch — this is months of iteration, shipped piece by piece on a product the whole ecosystem relies on daily.
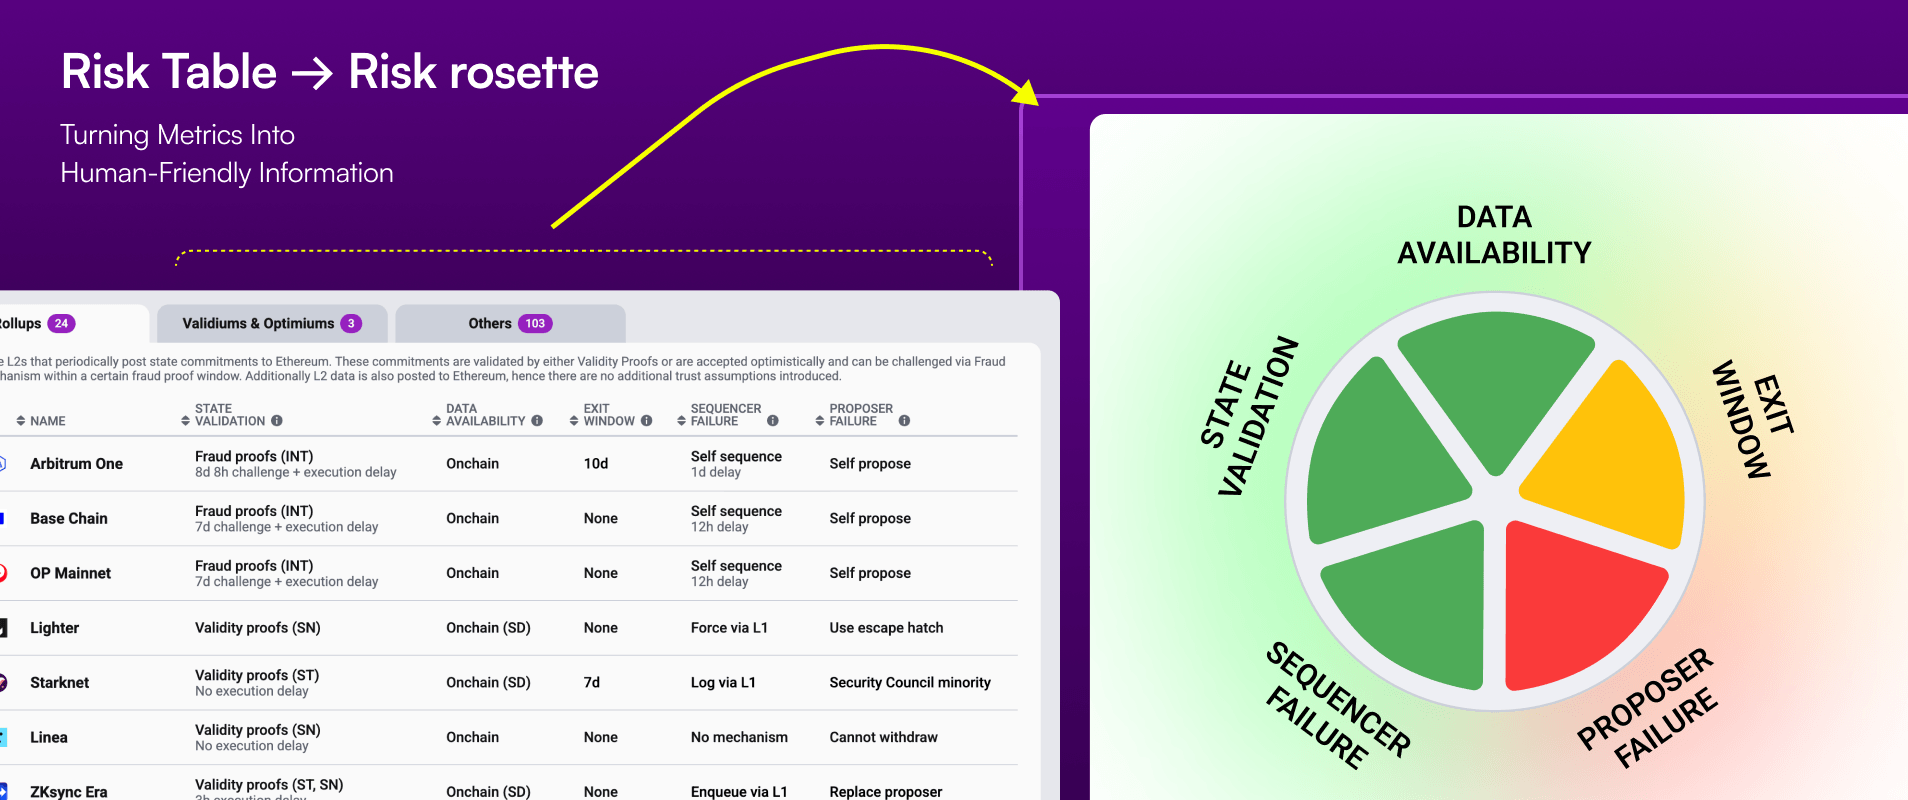
The risk analysis table was five columns of technical jargon — state validation, data availability, exit window, sequencer and proposer failure. Experts could parse it; everyone else bounced. Instead of building an even more complex table, I sketched a five-segment glyph — one slice per trust dimension, green to red — that reads at a glance in a 100-row table and expands into full detail on every project page. Neutrality was the constraint: same visual weight for every network, no dramatics.
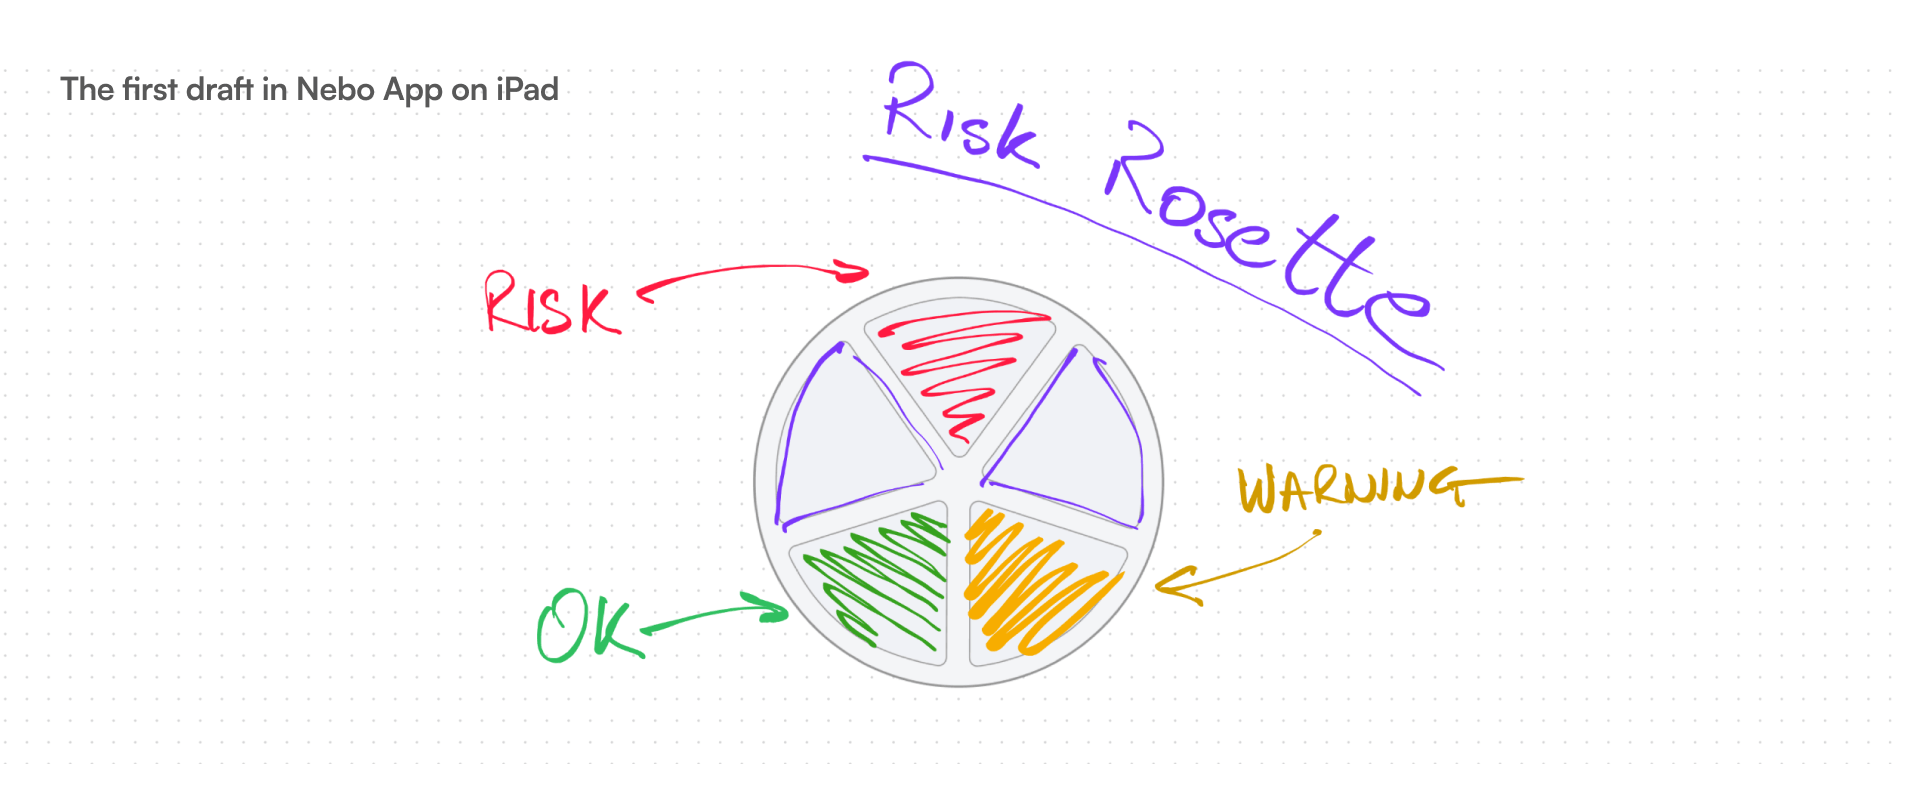
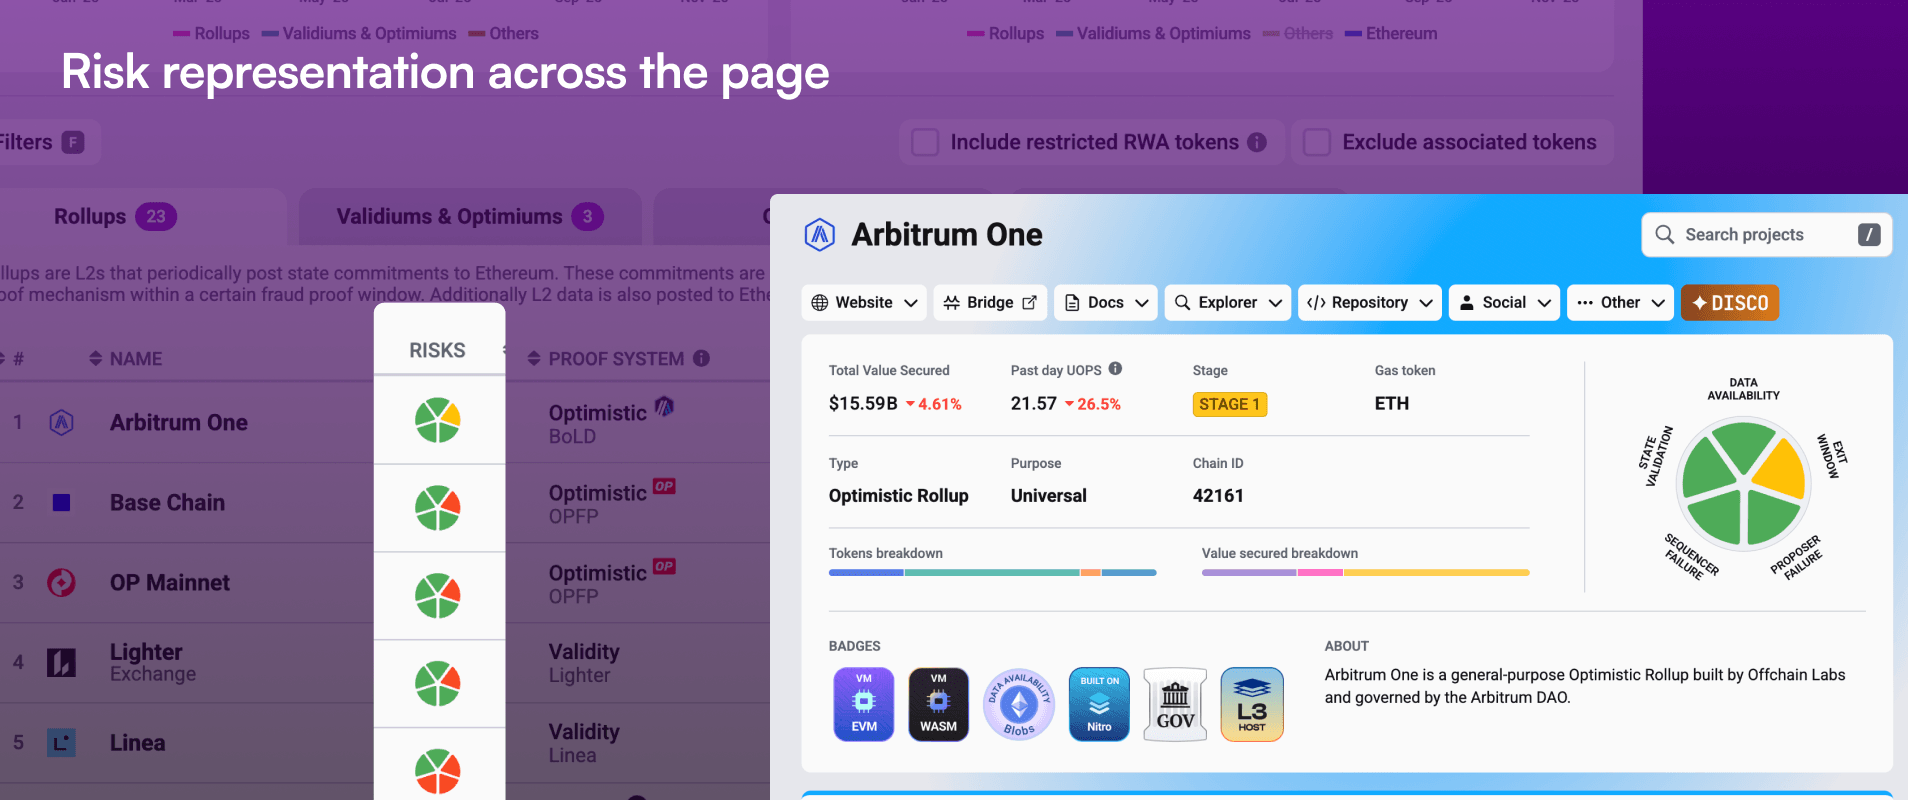
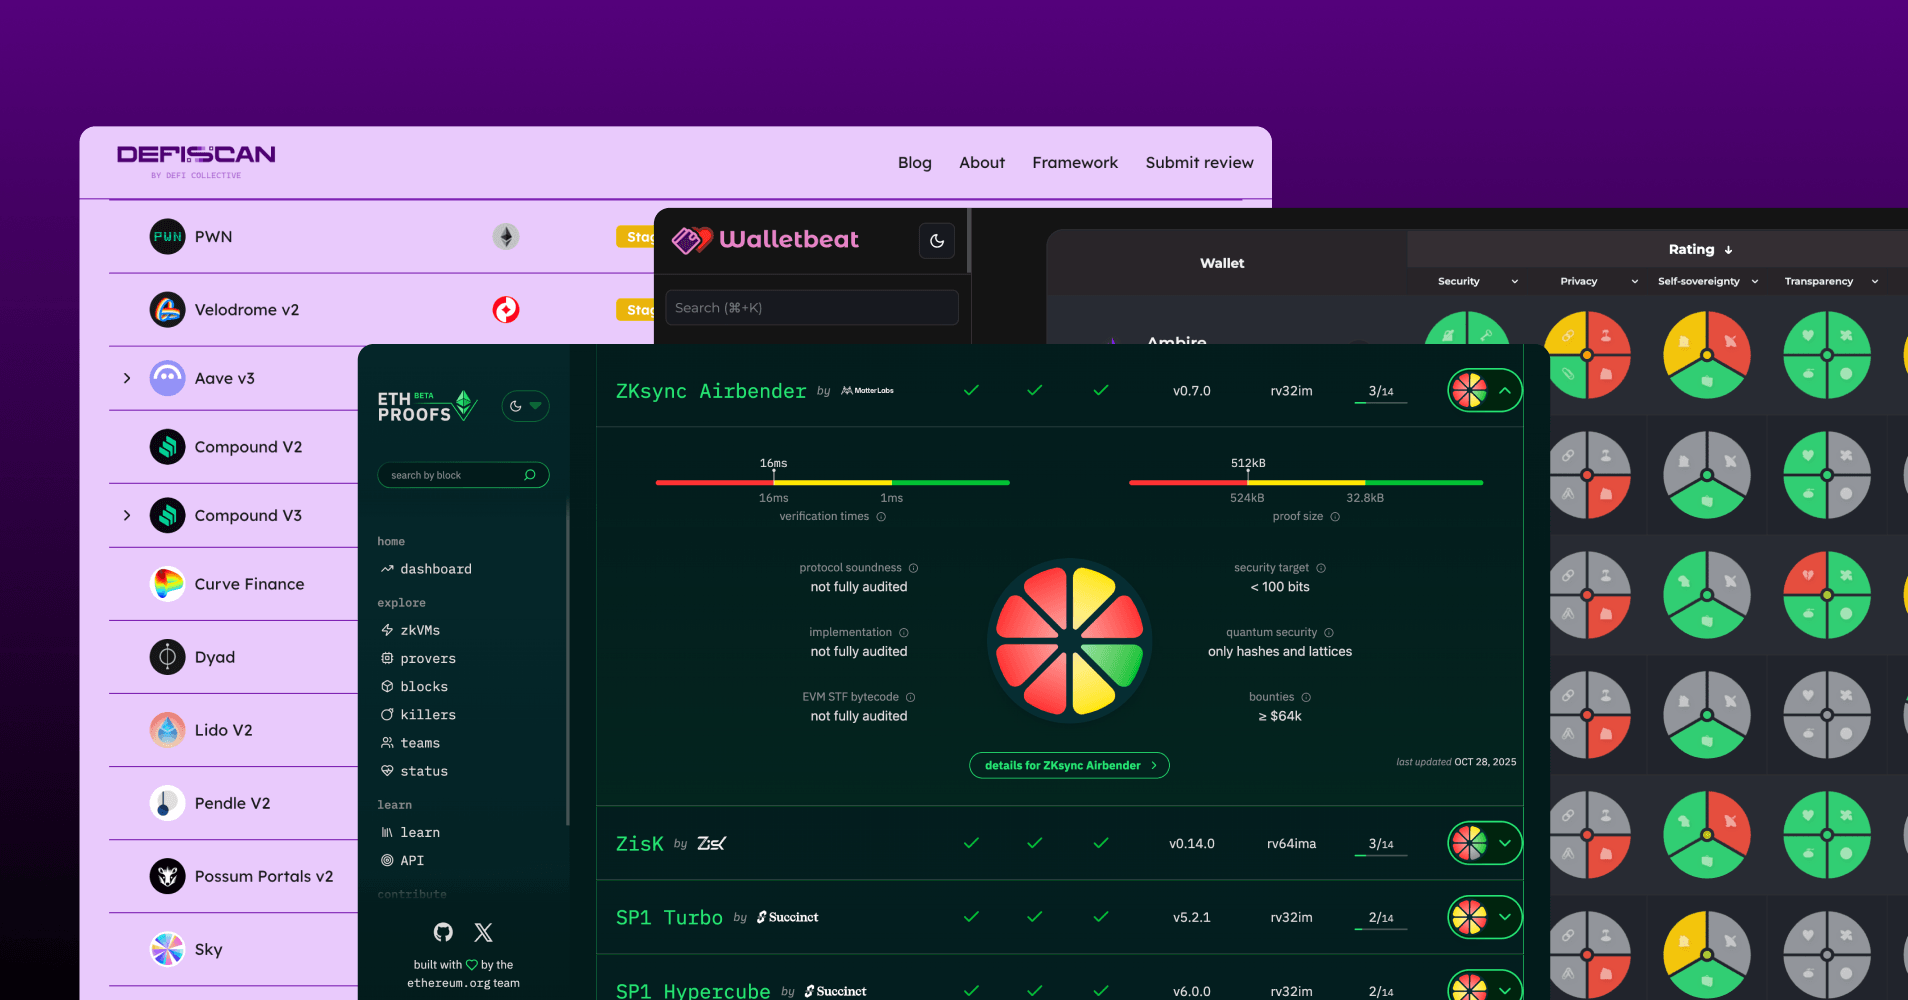
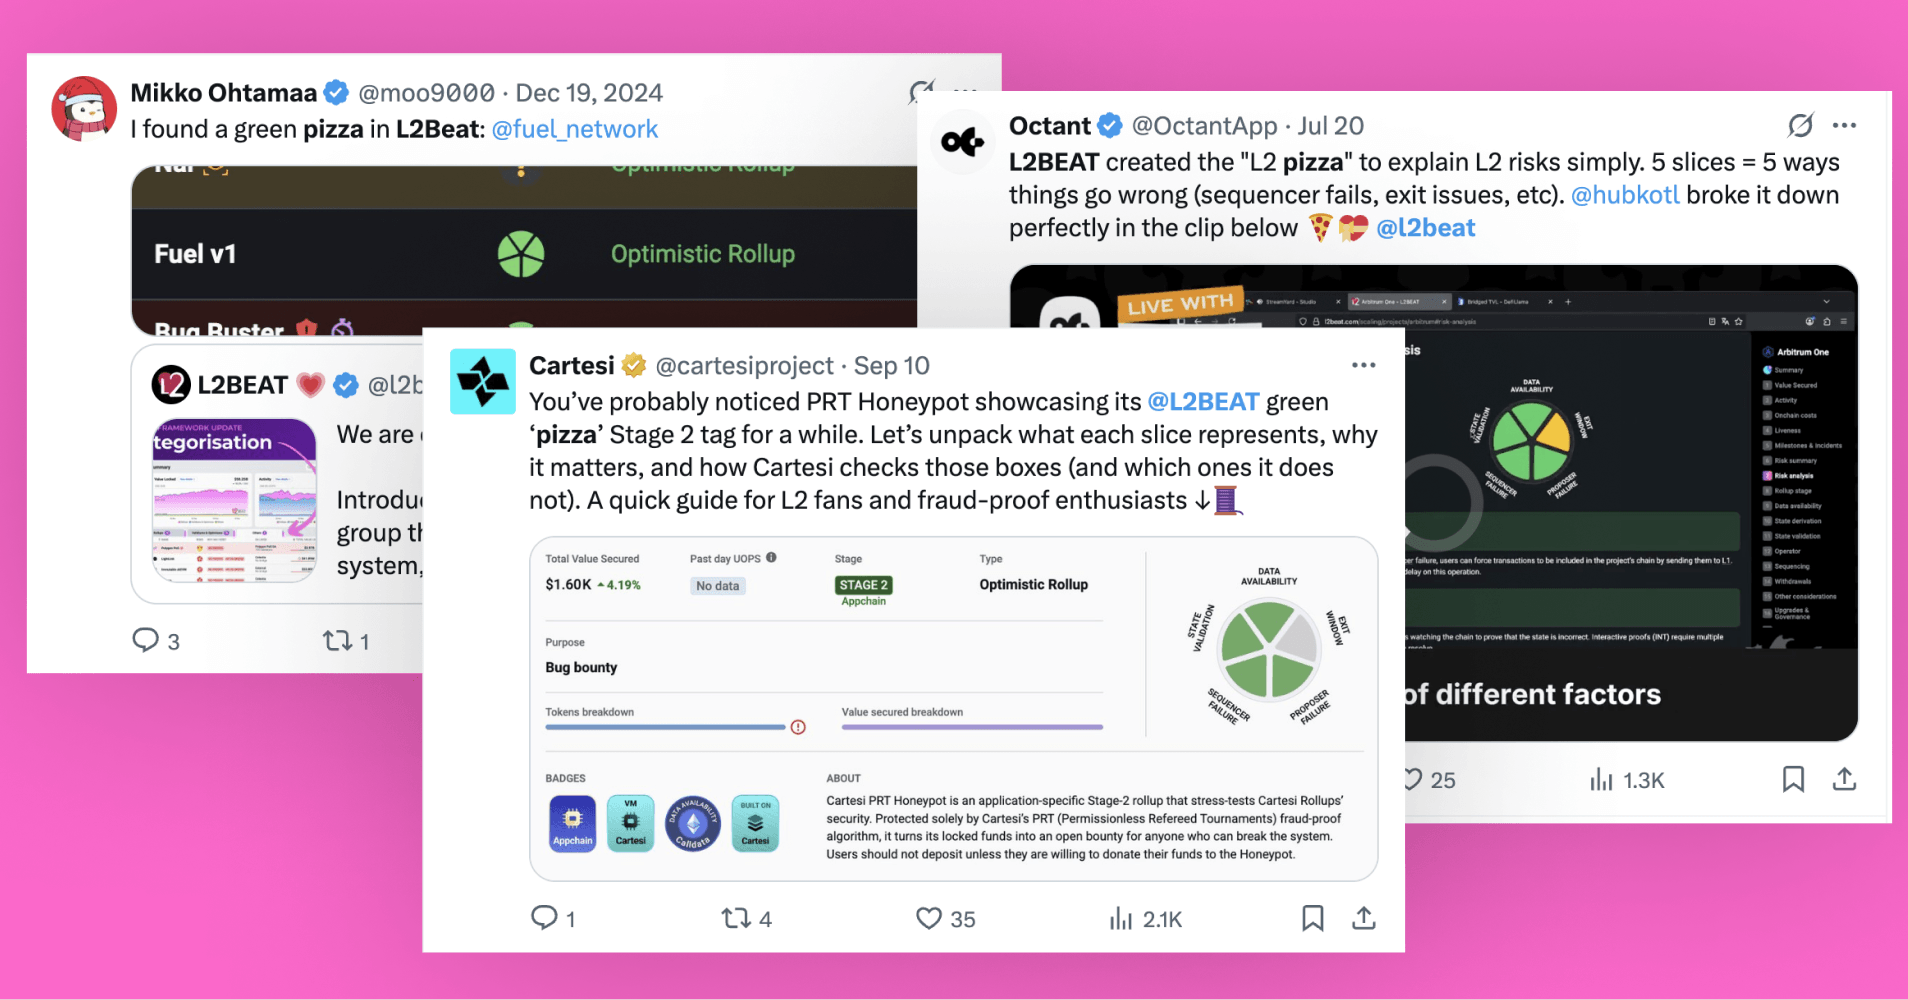
The ecosystem did the rest. The community renamed it "the L2 pizza", protocols celebrate turning their slices green, and the pattern has since been adopted by other tools across the ecosystem — DeFiScan, Walletbeat, ETH Proofs. I told the full story at Devconnect Conference in Buenos Aires.
Project pages were a wall of text with one TVL chart. The redesign gave every network a structured profile — key stats and stage up top, the risk rosette, badges, and a sectioned deep-dive that holds the research team's full analysis without burying the reader.
L2BEAT is the reference point for L2 risk in the Ethereum ecosystem — cited by protocols, media, and researchers. Design here isn't decoration: it's how $35B of tracked value stays legible.